Career Project
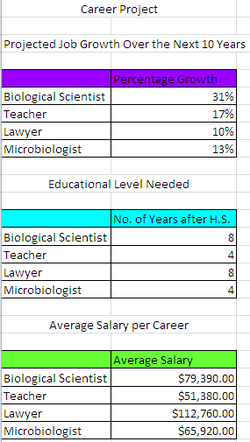
In this project we took all of the information from the career research adn compiled it into charts of percentage growth, number of years after high school, and average salary. We then made them into graphs so it was easier to see all of the information in one spot. Looking at the graphs will make it easier to see which job is better for the different careers. It will make organization easier and more simple. We also color coordinated everything so that it was easy to see which graph we were looking at.
Glogster Project
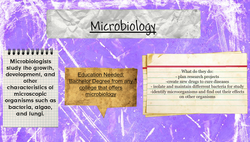
In this project we took all of our information and put it together in a glog. We took our career information. We embedded video and pictures and linked information to a credible source. I learned how to use all of the tools and materials in glogster. If I were to do this again I would make it more creative. Microbiology is the field that I want to study so this glogster helped put it all in perspective.
