37 Stocks
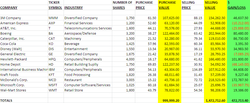
In this activity we learned how to format excel sheets. We learned about stocks of different companies. We learned how to evaluate different things within stocks. We ad to look at the information and see which was the best and worst stock. We also learned about different formatting within different numbers. I was good at the formatting but need to work on my typing skills.
Excel #22
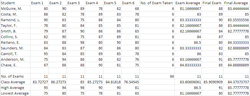
In this activity we had to put data into a gradebook. We took the data and used different equations to get answers to specific questions. We used a bunch of new equations in this activity. We learned how to enter new equations in Microsoft Excel. These equations were the max, min, count, and average formulas. I used these equations well. If i would do it again I would set up the gradebook differently.
Excel #45 iPhone Games
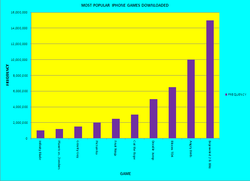
In this activity we made a bar graph of how many downloads an iPhone game gets. We had practice putting information into an excel worksheet. We then put the information into a column chart. We then had to format the chart. We had to chang the colors of everything. We also had to chang the x-axis to be rotated 90 degrees. We had to add in both axes and the title. We also had to format the y-axis. In this activity I did the color and making the chart well. I had a hard time with changing the axes. If I had to do it again I would make it have better colors.
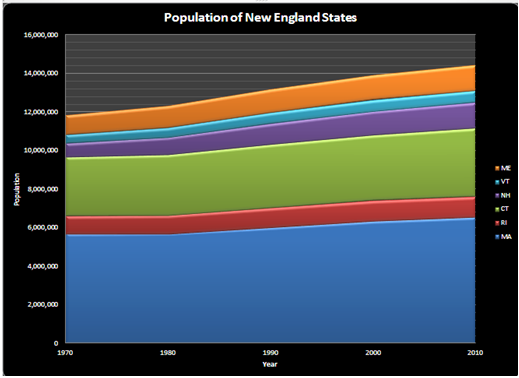
Area Chart Presentation Project
|

|
In this project we learned many things. We had to learn how to create area charts and teach it to the class. We needed to make a powerpoint to explain how to do it and create an activity for the class to practice with. We helped all the students with whatever they needed help with. We had to collect data and put it into a spread sheet to make the activity and we needed to transofrm it into an area chart. We then had to make a powerpoint to explain each step and how to do it. We then had to present it to the whole class.
Excel #50
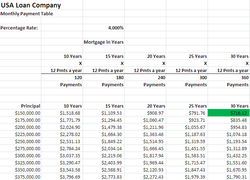
This activity showed how many years anad how much different loan payments are. We had to put all the data in spread sheet and use the new PMT formula that we learned. Then we had to decided the most expensive and inexpensive loans. The formula did all of the work for us. We had to put in how many years times the number of months to equal the number of payments. For some of the formulas we multiply the pricipal by the number of payments times the PMT.
